The Map Covers Less Than Half the Work
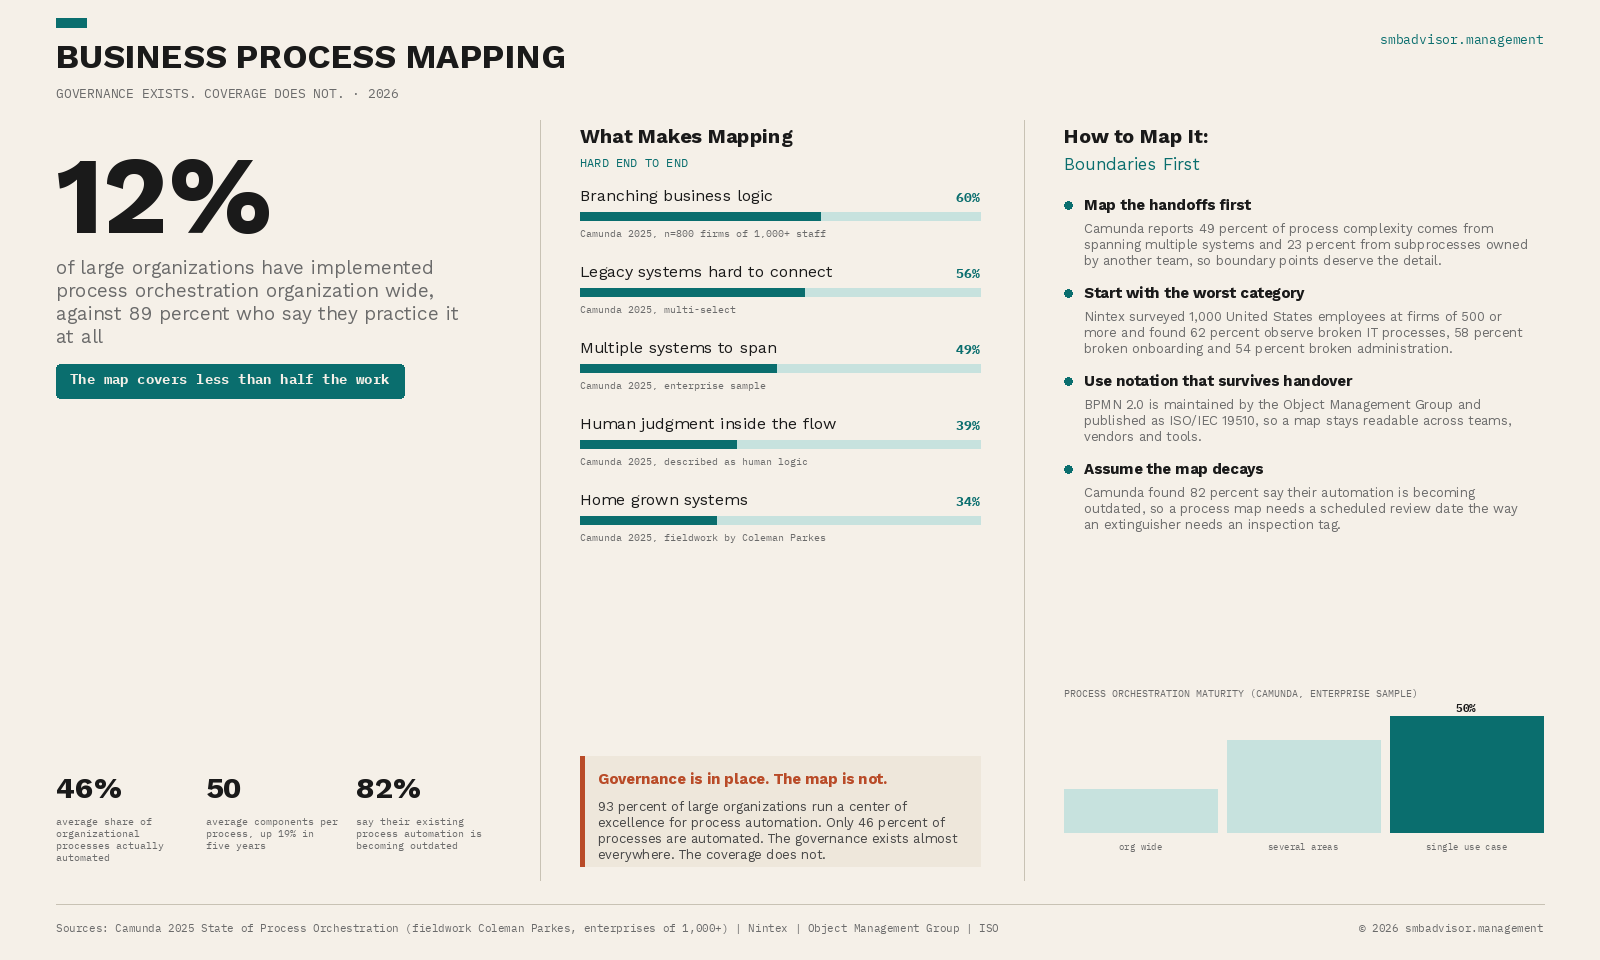
Business process mapping is the practice of documenting how work actually moves through an organization, including the systems, handoffs and decision points involved. Camunda surveyed 800 organizations of 1,000 or more staff and found 89% say they practice process orchestration, while only 12% have implemented it organization wide and just 46% of processes are actually automated. Note the sample: these are large enterprises, not small businesses. The pattern is worth reading anyway, because the failure mode scales down intact.
Complexity Lives at the Boundaries
Asked what makes end to end processes hard, respondents named branching business logic at 60%, legacy systems that are difficult to connect at 56%, spanning multiple systems at 49%, human judgment inside the flow at 39%, and home grown systems at 34%. Boundaries dominate. Camunda also found the average process now contains about 50 components, up 19% in five years, and 23% of complexity comes from subprocesses owned by another team. That last figure is the one most maps miss, because the team drawing the map usually stops at the edge of what it owns.
Governance Is Not Coverage
93% of these organizations run a center of excellence for process automation, yet 72% say their initiatives cannot keep pace with change and 82% say their existing automation is becoming outdated. The structure exists almost everywhere. The coverage does not. Two practical implications follow. Use notation that survives handover, which in practice means BPMN 2.0, maintained by the Object Management Group and published as ISO/IEC 19510. And give every map a scheduled review date, because a process map decays the way an extinguisher does and needs the same inspection tag.
Sources: Camunda 2025 State of Process Orchestration (fieldwork by Coleman Parkes, enterprises of 1,000+), Nintex, Object Management Group, ISO